


Key Takeaways:
- Trendlines predict the prevailing direction by determining the likely support or resistance levels, helping traders understand the current trend, and time their entries and exits with proper context.
- A trendline is a straight line connecting at least two, ideally three, swing highs or lows to visualize upward, downward, or sideways momentum.
- They reveal trend direction, acting as dynamic support or resistance, and filtering short-term noise so trade decisions align with dominant market bias.
- Use clean charts and anchor the line to multiple meaningful swing points, since more confirmed touches generally strengthen the trend signal.
- Trade bounces within channels or breakouts beyond lines, confirming with volume or indicators to refine entries, stops, and take-profit levels.
- Lines can fail during consolidations or counter-moves, so always seek confluence with other tools and manage risk with predefined stops.
- The same drawing and trading rules work for forex, indices, metals, energies, shares, and crypto because price structure and momentum are universal.
What is a Trendline?
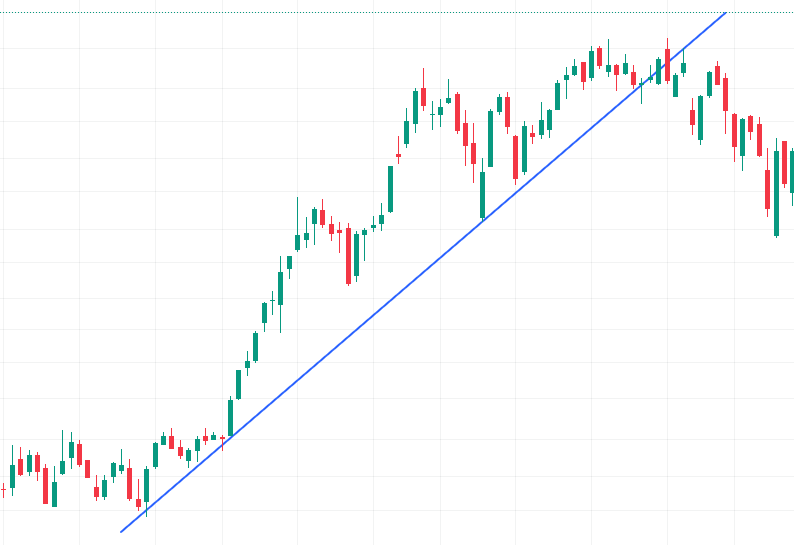
Trendlines are diagonal lines that traders draw on price charts to show the overall direction of price movement, whether it's moving up, down, or sideways. When prices are trending upward, bullish trendlines are created by connecting a series of low points, clearly showing the upward price trend in motion.
Conversely, bearish trendlines are formed by connecting a series of high points, which reveals a downward price trend. In markets that lack clear direction, sideways trendlines can be drawn by connecting various highs and lows, indicating a trendless or sideways-moving market. An important characteristic of trendlines is their ability to function as support and resistance levels, creating zones where prices often bounce off or potentially break through, making them valuable tools for predicting future price behavior.
Downward trendlines are drawn off the highs and slope down, signalling a bearish bias in forex, energies, or indices markets.
Upward trendlines connect the lows and slope up, indicating bullish momentum in cryptocurrencies, shares, or metals.
Whether you trade forex, crypto, metals, indices, whether you practice day trading, swing trading or scalping, drawing a simple line through key highs or lows instantly reveals the market’s true direction—cutting through the noise so you know when momentum is picking up or slowing down.
By understanding whether the market is respecting these trendlines, traders can align CFD strategies on crypto, gold, or stock indices with the most probable direction of price movement.
Benefits of Using Trendlines in Trading
Trendlines offer several practical benefits across all major asset categories:
Visualise the overall trend: They clarify whether prices in forex, commodities, or share markets are generally moving up, down, or sideways.
Identify support and resistance: Prices often react around trendlines in energies, cryptocurrencies, and metal CFDs, offering clear entry and exit zones.
Reduce noise: By smoothing out short-term volatility in forex or crypto charts, trendlines highlight the dominant market direction.
Gauge volatility: Drawing multiple trendlines can reveal shifts in momentum in commodity, share, and index trading.
Platforms like MetaTrader 4 and MT5 allow you to draw trendlines manually or automatically connect highs and lows on cryptocurrency or forex charts, teaching you how to draw trend lines step by step.
Finding & Drawing Accurate Trendlines
For better results in forex, crypto, and commodities, follow these steps to draw accurate trendlines and master trendline trading:
Open a clean chart without indicators in your trading platform.
Identify the highest or lowest price point on the indices, energies, or shares chart.
Select the line tool and click on this point, dragging it to the chart’s endpoint—this shows how to draw trend lines.
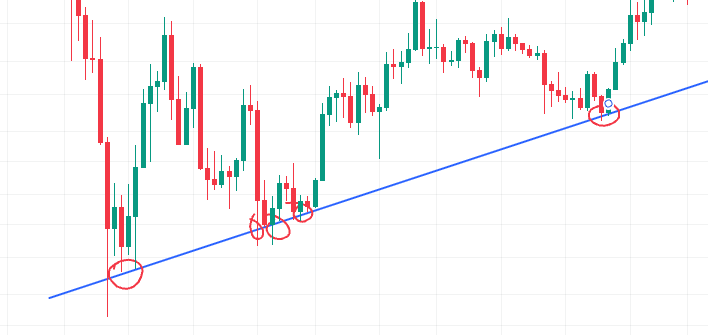
Adjust until the trendlines touch at least two significant peaks or troughs—three points for added strength.
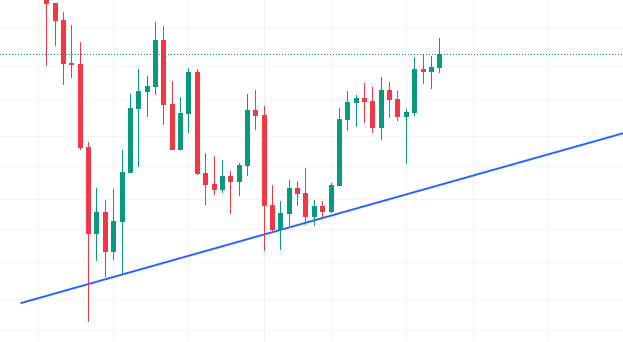
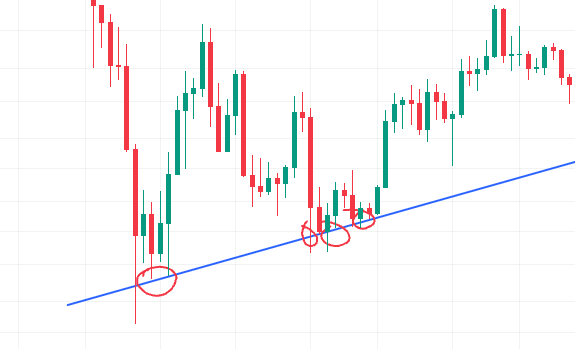
Trendlines that are tested multiple times are considered as having the strength of ‘confirmed’, and will tend to revisit the trend line again if it is still fluctuating without entering a different phase.
Therefore, a valid trendline in trading crypto CFDs or any other asset classes, should connect at least three swing points. The more touchpoints, the stronger the trendlines signal.
How to Trade with Trendlines
Range Trading Using Trendlines
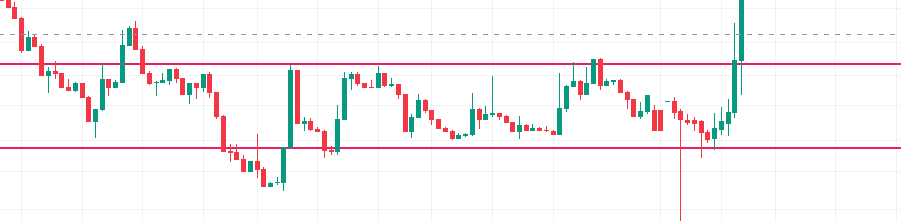
When parallel trendlines form a channel in forex or stock index CFDs, you can:
Buy (go long) near the lower trendline when bullish indicators confirm.
Sell (go short) near the upper trendline when bearish signals appear.
This works equally well in gold, silver, energies, and cryptocurrencies if you trade CFDs on these markets, exemplifying trading line strategies.
Trendline Breakout Strategies
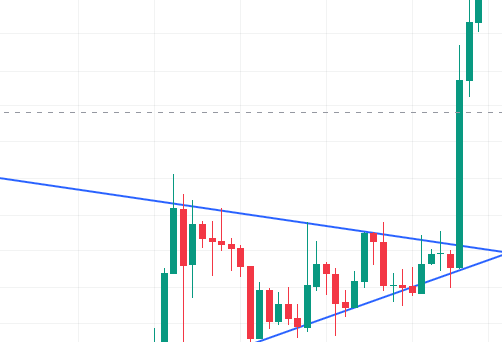
Breakouts through trendlines in forex, crypto, or share CFDs can trigger strong moves:
A close above the upper trendline—often on higher trading volume—signals a bullish breakout.
A close below the lower trendline indicates a bearish breakout.
Open long or short CFD positions on energies or crypto accordingly, using trendlines to time entries.
Key Cautions for Trendline Trading
Markets move in jagged patterns—two steps forward, one step back. A trendline doesn’t guarantee direction; it may reflect a counter-trend or consolidation. Always confirm trendlines with other indicators and broader market context in indices, forex, or commodities before trading.
Applying Trendlines Across Different Markets
You can apply trendlines in virtually any market:
Indices (e.g., S&P 500, NASDAQ)
Forex majors and minors
Energies (e.g., crude oil, natural gas)
Shares (CFDs on global stocks)
Metals (gold, silver, platinum)
Cryptocurrencies (Bitcoin, Ethereum, altcoins)
Trendline methods are universal: the same principles guide trendlines on crypto, metal, or share charts.


