


What is Fibonacci Retracement?
Fibonacci retracement is a popular tool used in technical analysis to identify potential support and resistance levels in financial markets. It's based on the Fibonacci sequence, a series of numbers where each is the sum of the two preceding ones: 0, 1, 1, 2, 3, 5, 8, 13, 21, and so on.
Key Fibonacci ratios used in trading include
23.6%
38.2%
50% (not a Fibonacci number, but widely used)
61.8%
78.6%
These ratios are derived from the relationships between numbers in the Fibonacci sequence. For example, 61.8% is the inverse of the golden ratio (1 / 1.618), while 38.2 % results from dividing one Fibonacci number by the number two places to its right in the sequence.
The Golden Ratio Connection
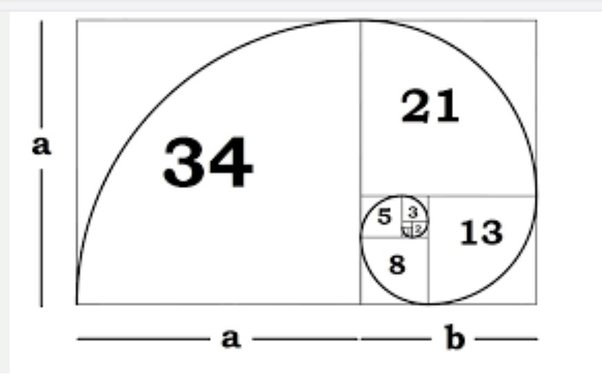
The golden ratio, approximately 1.618 or its inverse 0.618, is closely related to the Fibonacci sequence. As the sequence progresses, the ratio between consecutive numbers approaches the golden ratio. This mathematical phenomenon is found throughout nature, from the spiral of a nautilus shell to the arrangement of leaves on a stem. Some traders believe it has significance in financial markets as well.
The golden ratio (61.8 %) is often considered the most important Fibonacci level in trading. Traders of all markets (Forex trading, Crypto Trading, Gold Trading and so on) pay close attention to this level, as the price often shows significant reactions when reaching it.
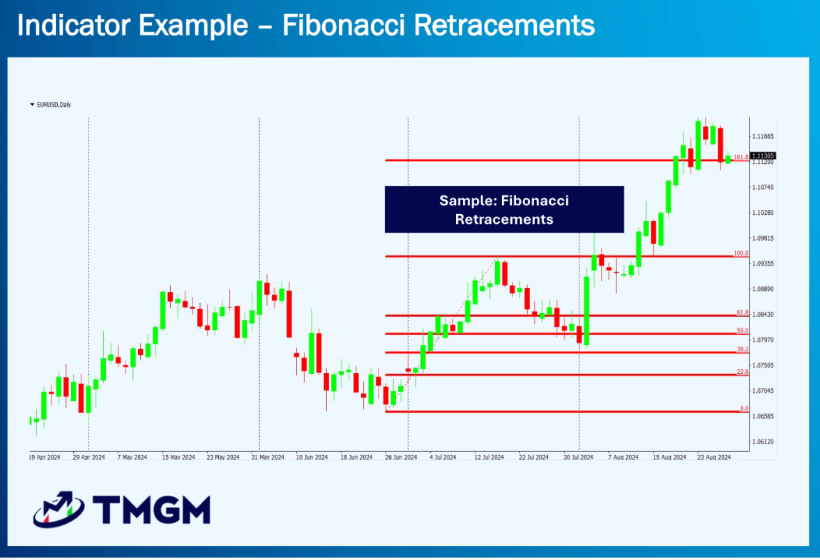
How to Use Fibonacci Retracement in Trading
Fibonacci retracement is a popular trading tool used to identify potential support and resistance levels during price pullbacks. It works best in trending markets, helping traders spot areas where price may pause, reverse, or continue.
Identifying Market Trends Before Drawing Fibonacci Levels
Identify whether the market is in an uptrend or downtrend. This is essential because Fibonacci retracement relies on directional price movements to project possible reaction zones.
How to Draw Fibonacci Retracement Levels
Choose a significant swing high and swing low to define the move. In an uptrend, apply the tool from the low to the high; in a downtrend, draw it from the high to the low. Most trading platforms offer built-in Fibonacci tools to automate this process.
Analyzing Support and Resistance Using Fibonacci Levels
Once drawn, the retracement tool will automatically display common levels like 23.6%, 38.2%, 50%, 61.8%, and 78.6%. These levels act as potential support in an uptrend or resistance in a downtrend. Look for price reactions at these zones as signals for entry or exit.
Combining Fibonacci Retracement with Other Indicators
Strengthen your strategy by pairing Fibonacci retracement with other tools like trendlines, RSI, MACD, or moving averages. This provides confluence and increases the reliability of trading signals.
Using Fibonacci Retracement Across Multiple Timeframes
Apply Fibonacci levels on different timeframes to identify overlapping zones. Confluence across timeframes often points to stronger support or resistance, increasing the likelihood of price reaction.
Practice Tips for Mastering Fibonacci Trading
Start by using demo or paper trading accounts to practice identifying valid swing highs and lows. Review your trades to refine your technique and gain confidence before trading live.
Advanced Fibonacci Techniques
Fibonacci Extensions for Profit Targeting
Fibonacci extensions go beyond the 100% level to help traders identify possible profit-taking areas, such as the 127.2% and 161.8% levels.
How Fibonacci Traders Map Trend Continuations
Fibonacci fans are diagonal lines based on retracement ratios. They are used to track potential trend continuation zones or dynamic support/resistance.
Using Fibonacci Time Zones to Forecast Market Timing
Instead of focusing on price, Fibonacci time zones apply the sequence to time intervals. This can help anticipate potential reversal or breakout points in the future.
Spotting Fibonacci Clusters for Strong Confluence Zones
Fibonacci clusters occur when multiple retracement or extension levels from different moves align in the same area. These zones often signal strong price barriers.
Limitations and Considerations
Subjectivity in Drawing Fibonacci Levels
Different traders may pick different swing points, leading to variation in the levels displayed. Practice and consistency in choosing points is key.
The Self-Fulfilling Nature of Fibonacci Levels
Many traders use Fibonacci levels, which sometimes causes the price to react at these points simply due to mass behavior rather than technical rationale.
Why Fibonacci Is Not a Standalone Trading Tool
Never rely solely on Fibonacci retracement. Use it as part of a broader strategy with confirmation from price action or indicators.
When Fibonacci Retracement May Not Work
In ranging or volatile markets, Fibonacci retracement can provide unreliable signals. It is most effective when the market shows a clear directional trend.
Applying Fibonacci Retracement with TMGM
TMGM (Trademax Global Markets) is a trusted broker that provides traders with the tools and platforms necessary to implement Fibonacci retracement strategies effectively. With its robust trading infrastructure, educational resources, and commitment to client success, TMGM offers a reliable environment for traders looking to leverage Fibonacci techniques in their trading approach.
When trading with TMGM, you can leverage Fibonacci retracement in several ways:
MetaTrader 4 and 5 Integration: TMGM offers MT4 and MT5 platforms with built-in Fibonacci tools. You can easily apply Fibonacci retracement to any chart and customize the levels' appearance.
Multi-Asset Application: TMGM provides access to various markets, including forex, indices, commodities, and cryptocurrencies. Fibonacci retracement can be applied across all these asset classes, allowing diverse trading opportunities.
Educational Resources: TMGM offers educational materials and webinars that often cover advanced trading techniques, including Fibonacci retracement. Take advantage of these resources to enhance your understanding and application of this tool.
Risk Management: Always apply proper risk management when using Fibonacci retracement in your TMGM trading account. Use the stop-loss and take-profit features to manage your risk based on the Fibonacci levels.
Demo Account Practice: Before applying Fibonacci retracement in live trading, use TMGM's demo account feature to practice and refine your strategy without risking real capital.
Combining the power of Fibonacci retracement with TMGM's robust trading infrastructure can enhance your trading strategy and decision-making process. However, always remember that no trading tool is infallible, and it's crucial to use Fibonacci retracement as part of a comprehensive trading plan that includes thorough market analysis and strict risk management.


